Hard but not early: Separating facts from fiction about New Zealand’s Covid-19 response
New Zealand's stringent approach was hard but not early and has come at the cost of nearly 2 million life years or the equivalent of more than 45,000 lives.

The perceived success of New Zealand government’s Covid-19 elimination strategy rests on two pillars. The first of these is the idea that New Zealand went “hard and early”. The second is that a strong health response is also the best economic response.
Recent data shows both claims to be questionable.
Researchers at Oxford University’s Blavatnik School of Government have been tracking the Stringency Index across countries of the world since the beginning of the pandemic. The index is created by aggregating various social distancing measures implemented by governments such as ban on large gatherings, closures of border, work-places and schools, limits on domestic and international travel and so on. The higher the score on this index the more stringent the measures.
Figure 1 shows how the Stringency Index changed across five island nations, Australia, Iceland, Japan, New Zealand and Taiwan for the early part of 2020. It is noticeable that for much of this time, New Zealand’s approach was less stringent than those of the other countries. It was only in late March that New Zealand enacted one of the most stringent lockdowns along with India and Israel.
In fact, there is actually a large amount of “mimicry” in the extent to which countries followed one another in imposing such lockdowns. 4 out of 5 countries in the Organization for Economic Cooperation and Development (OECD) adopted very similar measures within a period of two weeks in March 2020. Given the differences among these countries in terms of their health care systems, their population characteristics and the spread of the disease, the coincidence in terms of the timing of these responses is striking.
Figure 1: Time path for Stringency Index for five island nations including New Zealand.

While voluminous evidence suggests that the aggregate benefits of lockdowns fall far short of the collateral damage, nevertheless one could make a case for them early on in the pandemic as a way of reducing pressure on healthcare systems and an opportunity to assess the degree of threat posed.
A key argument behind lockdowns is that they prevent infection transmission. But this implies that in order to be effective lockdowns must be imposed when case numbers are rising. Imposing a lockdown when the case numbers have started to decline makes little sense. Yet, available evidence suggests that in most cases lockdowns were imposed after case numbers had started to decline. This is true of the UK as well as New Zealand.
Figure 2 shows the path of infection transmission in New Zealand in the early part of 2020. The blue line indicates when New Zealand’s first lockdown in April 2021 was enacted. It is clear that the growth rates of infections was on the wane prior to that. The red line shows what happens 2 weeks later, which is when supposedly the impact of the lockdowns would be felt. If the lockdowns are really successful in dramatically reducing transmissions then one would expect a sharp decline in case numbers immediately following the red line. This is not the case. Growth rate of case numbers were declining even prior to the lockdown and the trend barely changes following the 2-week incubation period when the effects of the lockdown should be manifest.
Figure 2: Time path of growth rate of cases in New Zealand in early 2020.

According to recent research undertaken by John Gibson of the University of Waikato, New Zealand most likely passed the peak infection point by March 16, 2020 and certainly by March 23, 2020. This means that the stringent five week lockdown imposed on the country after those dates was essentially pointless since case numbers had already started to decline. What saved us was not the lockdown but the fact that we have a low population density and no land borders.
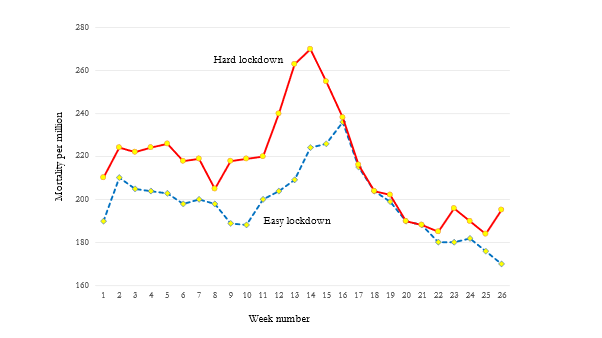
Did lockdowns result in fewer deaths? Figure 3 shows the total mortality impact of hard and easy lockdowns across the 24 European countries. The countries included in the study are: Austria, Belgium, Bulgaria, Czech Republic, Denmark, Estonia, Finland, France, Germany, Hungary, Iceland, Italy, Latvia, Lithuania, Luxembourg, Netherlands, Norway, Poland, Portugal, Slovakia, Spain, Sweden, Switzerland and United Kingdom. Total mortality here refers to deaths from all causes including those from Covid-19 as well as others. A country is categorized as one with a “hard” lockdown if its average lockdown stringency is above the median Stringency Index of all the sampled countries; otherwise the lockdown is categorized as “easy”. It is clear that all-cause mortality was higher in countries with harder lockdowns.
Figure 3: Severity of lockdowns and mortality rates for 24 European countries. Figure re-created by author on the basis of data provided by Bjørnskov (2021).
Was a strong health response also the best economic response? Unfortunately, here too the evidence does not support the claim. John Gibson looks at data for 32 OECD countries and explores the relationship between the Stringency Index and GDP growth rates.
Figure 4 presents the results. Countries with a higher value of the Stringency Index fared worse in terms of GDP growth rate.
Figure 4: Growth rates are lower in countries with a higher Stringency Index

This drop in GDP has consequences for lives too. New Zealand’s real GDP in 2020 was 5.2% lower than expected amounting to $14 billion of output not produced. Forecasting through to the end of 2023 this gap will grow to $36 billion in real terms. Gibson’s estimates suggest that given what we know about the relation between GDP growth and life expectancy, this projected drop in output will lower life expectancy for each Kiwi by around 8 months. This is equivalent to 2 million fewer life years or the equivalent of 45,350 deaths! The actual drop in life expectancy may be higher based on the long-term fiscal projections released by Treasury recently, which cuts the forecast life expectancy growth by around two years compared to the forecast back in 2016.
This is a lot of lives lost; certainly orders of magnitudes higher than what we may have lost to Covid-19.